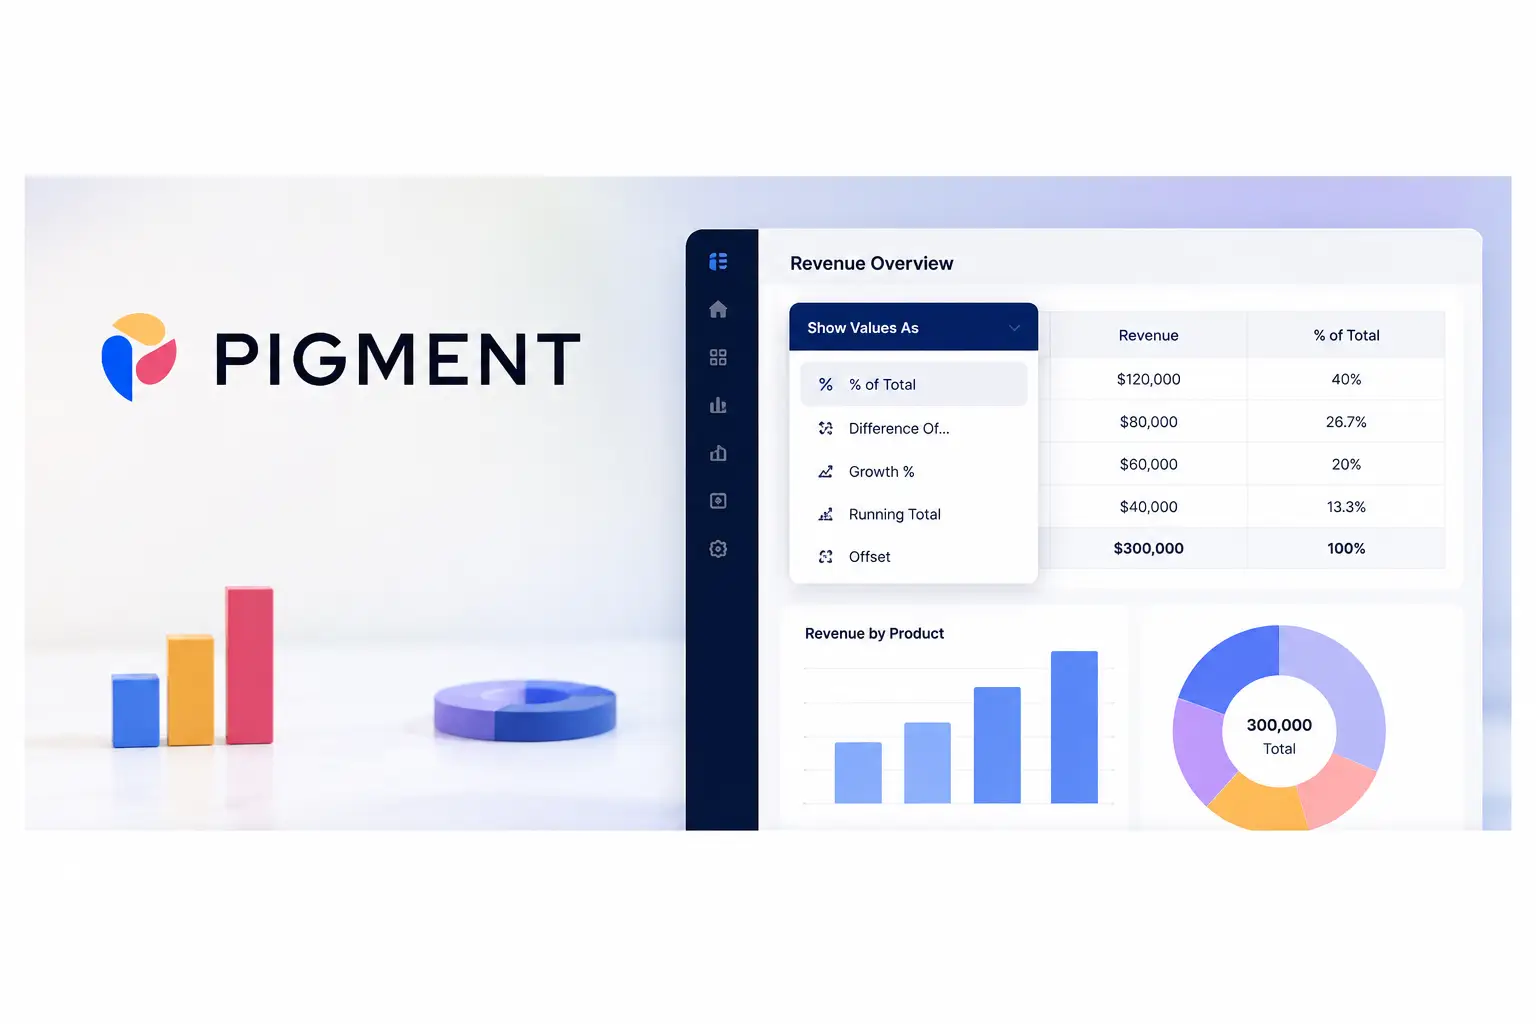
Pigment provides its users with a feature called Show Values As, designed to enhance data analysis within reports and dashboards. This capability transforms how values are displayed to facilitate comparisons and the interpretation of metrics, without modifying the underlying data.
Integrated into the platform's metrics and tables, this feature gives Finance, FP&A teams and decision-makers a way to quickly obtain more relevant analyses from their data.
Multiple calculation modes to meet different analytical needs
The Show Values As feature offers several types of calculations for examining performance from different perspectives.
Users can display a value as a percentage of a total, a specific item or another metric. It is also possible to calculate variances between different values, perform additions, measure growth rates or shift data to compare successive periods.
Pigment also includes running total functions to track the progressive evolution of a metric, while offering the ability to reset these totals according to defined dimensions.
Dynamic analysis using variables
One of the distinctive features of this functionality is its ability to use variables. Users can therefore base their calculations on dynamic elements, such as a selected month or period, without having to manually modify their reports.
This approach makes it easier to update analyses when reference periods change and helps further automate reporting processes.
Presets to accelerate reporting
To simplify the most common analyses, Pigment also provides several ready-to-use presets.
These include Year over Year (YoY), Month over Month (MoM), Year to Date (YTD), Last Year and Last Month comparisons, as well as other time-based indicators frequently used by finance teams.
These templates enable standardized analyses to be produced quickly while minimizing the required manual steps.
A feature dedicated to data visualization
Pigment specifies that calculations performed with Show Values As are intended to improve data display and analysis in reports. Unlike formulas created directly in the data model, these calculations cannot be reused in other metrics.
This distinction allows users to choose the most appropriate approach depending on whether they want to produce a one-off visual analysis or build calculations intended for reuse across their model.
An enhancement that strengthens Pigment's analytical capabilities
With Show Values As, Pigment enhances its reporting tools by offering a comprehensive range of analytical calculations directly integrated into dashboards. The feature is intended to simplify performance comparisons, accelerate the production of metrics and provide a clearer view of the data, while preserving the integrity of the underlying model.
This enhancement reflects the publisher's commitment to providing Finance departments and FP&A teams with increasingly flexible tools to make effective use of their decision-making data.
source: Pigment